sort()
In our CO2 emission data set we want to order
the plants based on the conc or uptake column. The sort() function sorts the vector in increasing order .
>conc <- CO2$conc
>conc = sort(conc)

order()
From this sorted vector we can find the least
and highest concentration details of all the plants. However , for more analysis
on the complete dataset instead of just the conc data , the function order() is more useful. It takes a vector and returns
the indices that sorts the vector .
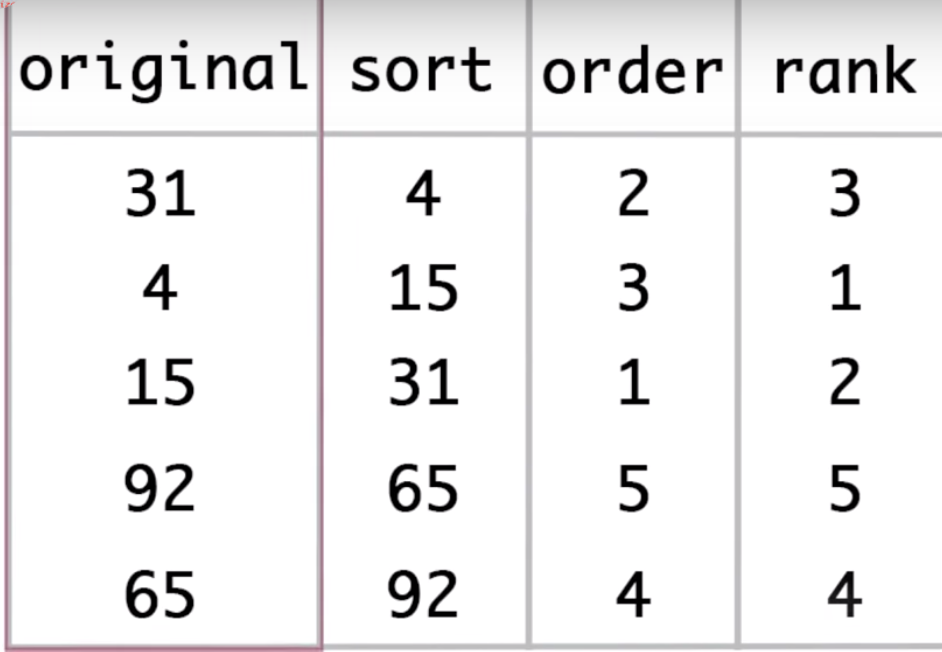
For Eg, consider 5 numbers 31 ,4, 15 ,92 and
65. The sort function on this data returns 4,15,31,65,92. Rather than sort the
vector, the function order gives us back the index that if used to index the
vector will sort it .
>index <- order(conc)

>conc[index]

Using this index which orders the dataset
based on the CO2 conc, we can order the rest of the columns for example we can print
the plant names having the least and highest concentrations of CO2.
>CO2$Plant[index]

max() and min()
If we are interested only in the entry with
the largest value we can use the max()
function . And which.max() gives us
the index of that entry. Similarly for minimum value we use the min() function and which.min() gives the index .
rank()
Like sort() and order() there is one more
function called rank() which for any
list , gives a vector with the rank of the first entry , second entry etc.
Eg : Let’s look at the vector of numbers used
earlier 31 ,4, 15 ,92 and 65. The rank of the this vector gives us 3,1,2,5,4 .
Because 31 , the first entry is the third smalles value in the list . 4 is the
smallest so it gets a 1 .

Summary
Here is the summary of the three functions
discussed above .Refer the R manual for more details on these sort functions.


No comments :
Post a Comment